Use Google Translator at Navigation Bar to read in any other Language -- Scroll Down for Weather Maps
Weather Forecast for Asian, Middle Eastern and East African Regions
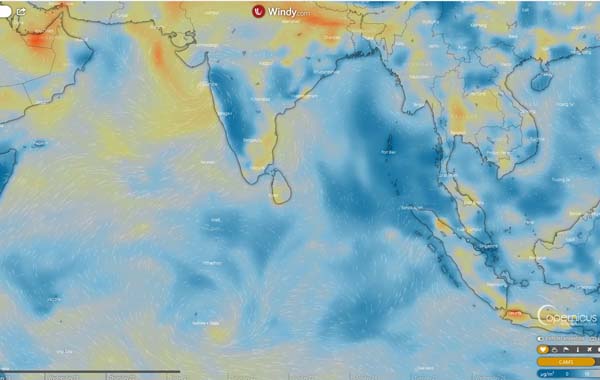
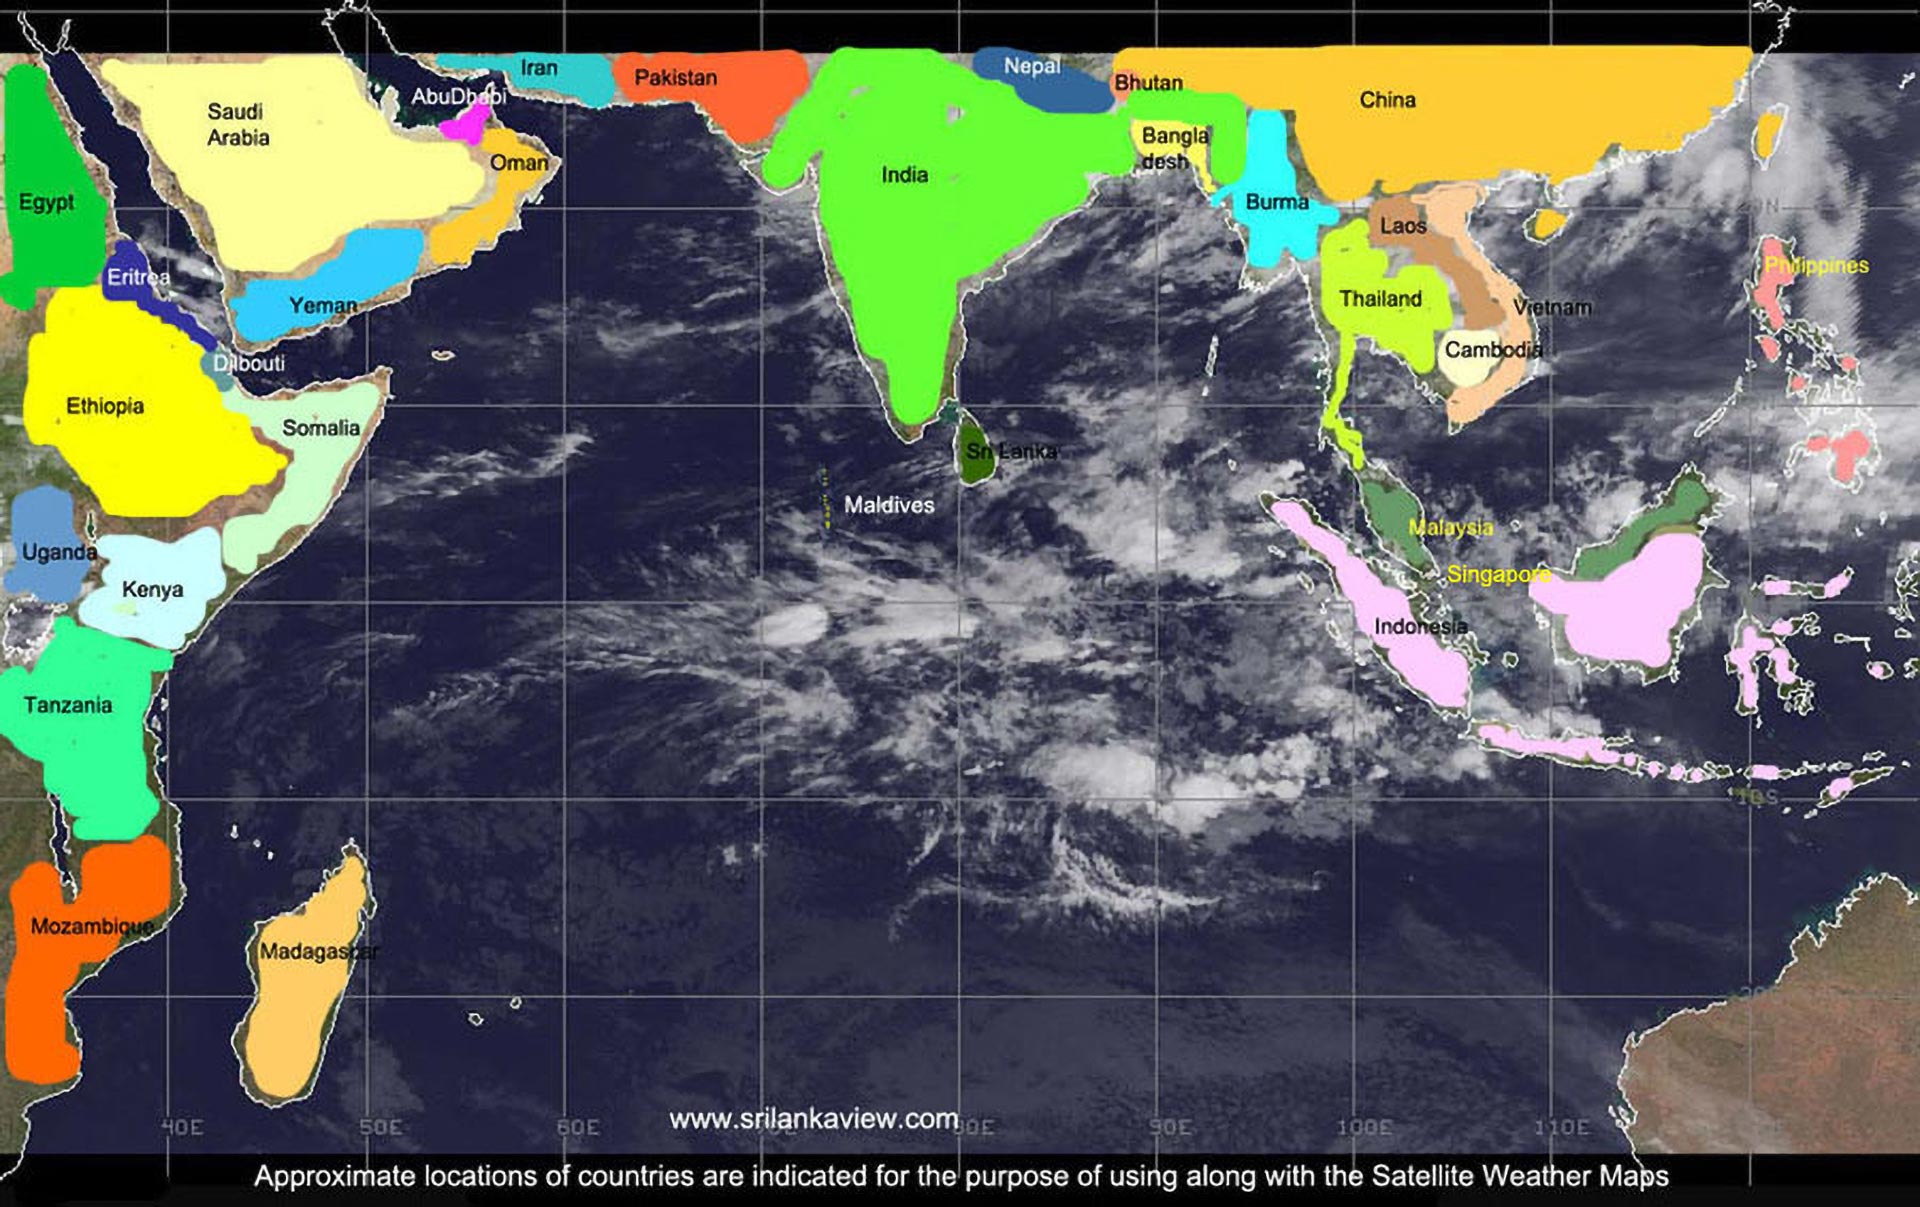
Based on the example map provided with countries marked, you can
easily identify the area you are searching for satellite weather information. Click for the larger map
Find your country in the map
Local Time for the Countries of the region
UTC (Universal Coordinated Time), was previously called as the Greenwich Mean Time and is the local time at Greenwich-England, which is at 0° longitude. Meteosat-8 Images marks the time of the image in UTC. Add the correct Hours and Minutes to the UTC time of the Weather Image to get the Local Time of your region as given in the following list.
Bangladesh + 6.00 Hours
Bhutan + 6.00 Hours
Burma + 6.30 Hours
Cambodia + 7.00 Hours
Egypt + 2.00 Hours
Eritrea + 3.00 Hours
Ethiopia + 3.00 Hours
India + 5.30 Hours
Indonesia Central + 8.00 Hours
Indonesia Eastern + 9.00 Hours
Indonesia Western + 7.00 Hours
Kenya + 3.00 Hours
Madagascar + 3.00 Hours
Malaysia + 8.00 Hours
Maldives + 5.00 Hours
Mozambique + 2.00 Hours
Nepal + 5.45 Hours
Pakistan + 5.00 Hours
Saudi Arabia + 3.00 Hours
Singapore + 8.00 Hours
Sri Lanka + 5.30 Hours
Tanzania + 3.00 Hours
Thailand + 7.00 Hours
UAE + 4.00 Hours
Vietnam + 7.00 Hours
Yemen + 3.00 Hours
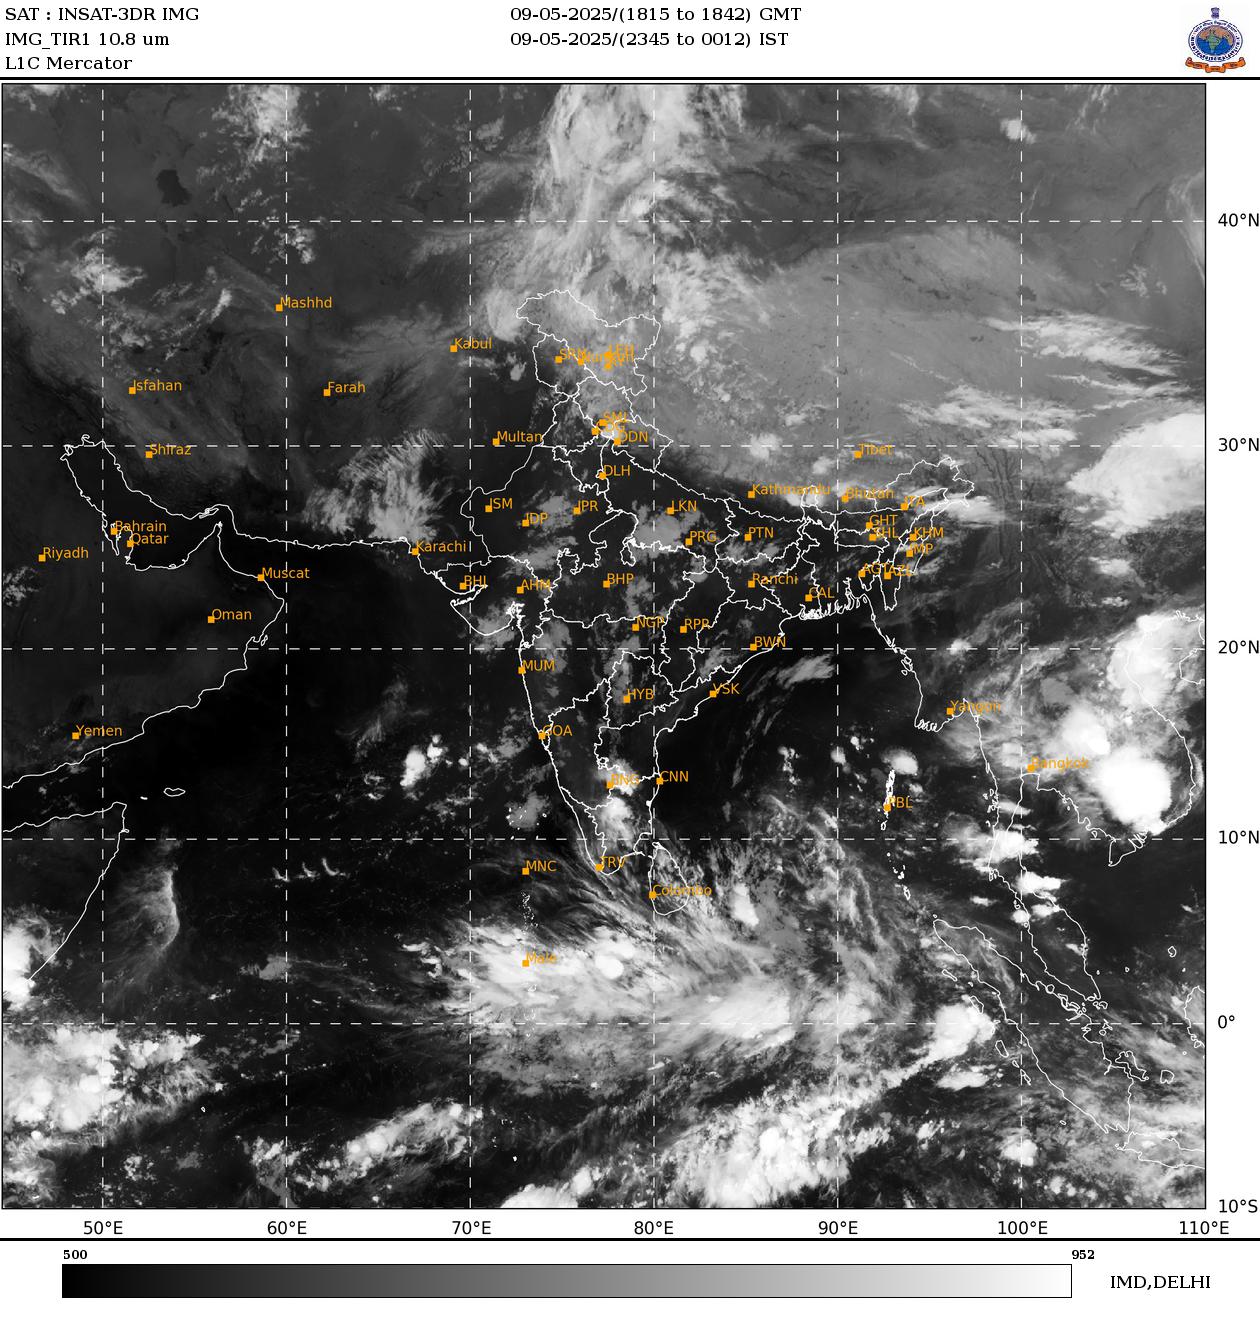
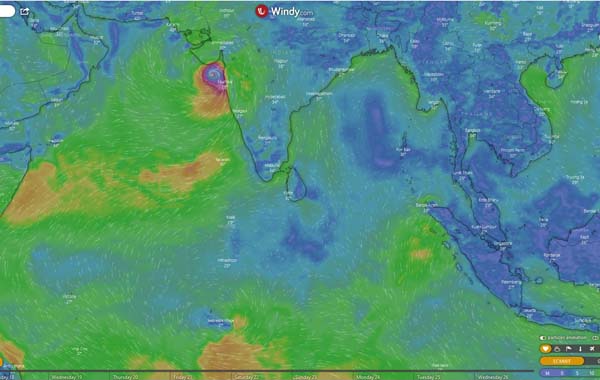
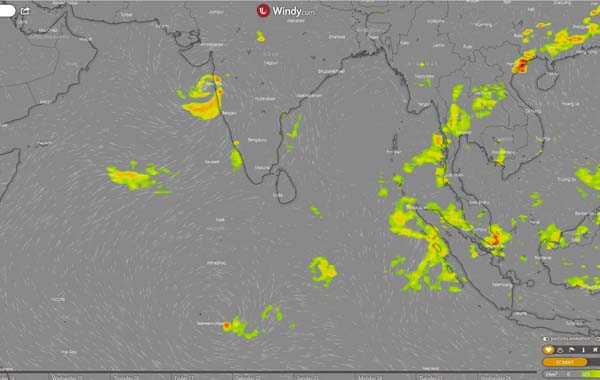
Reading a Satellite Weather Map
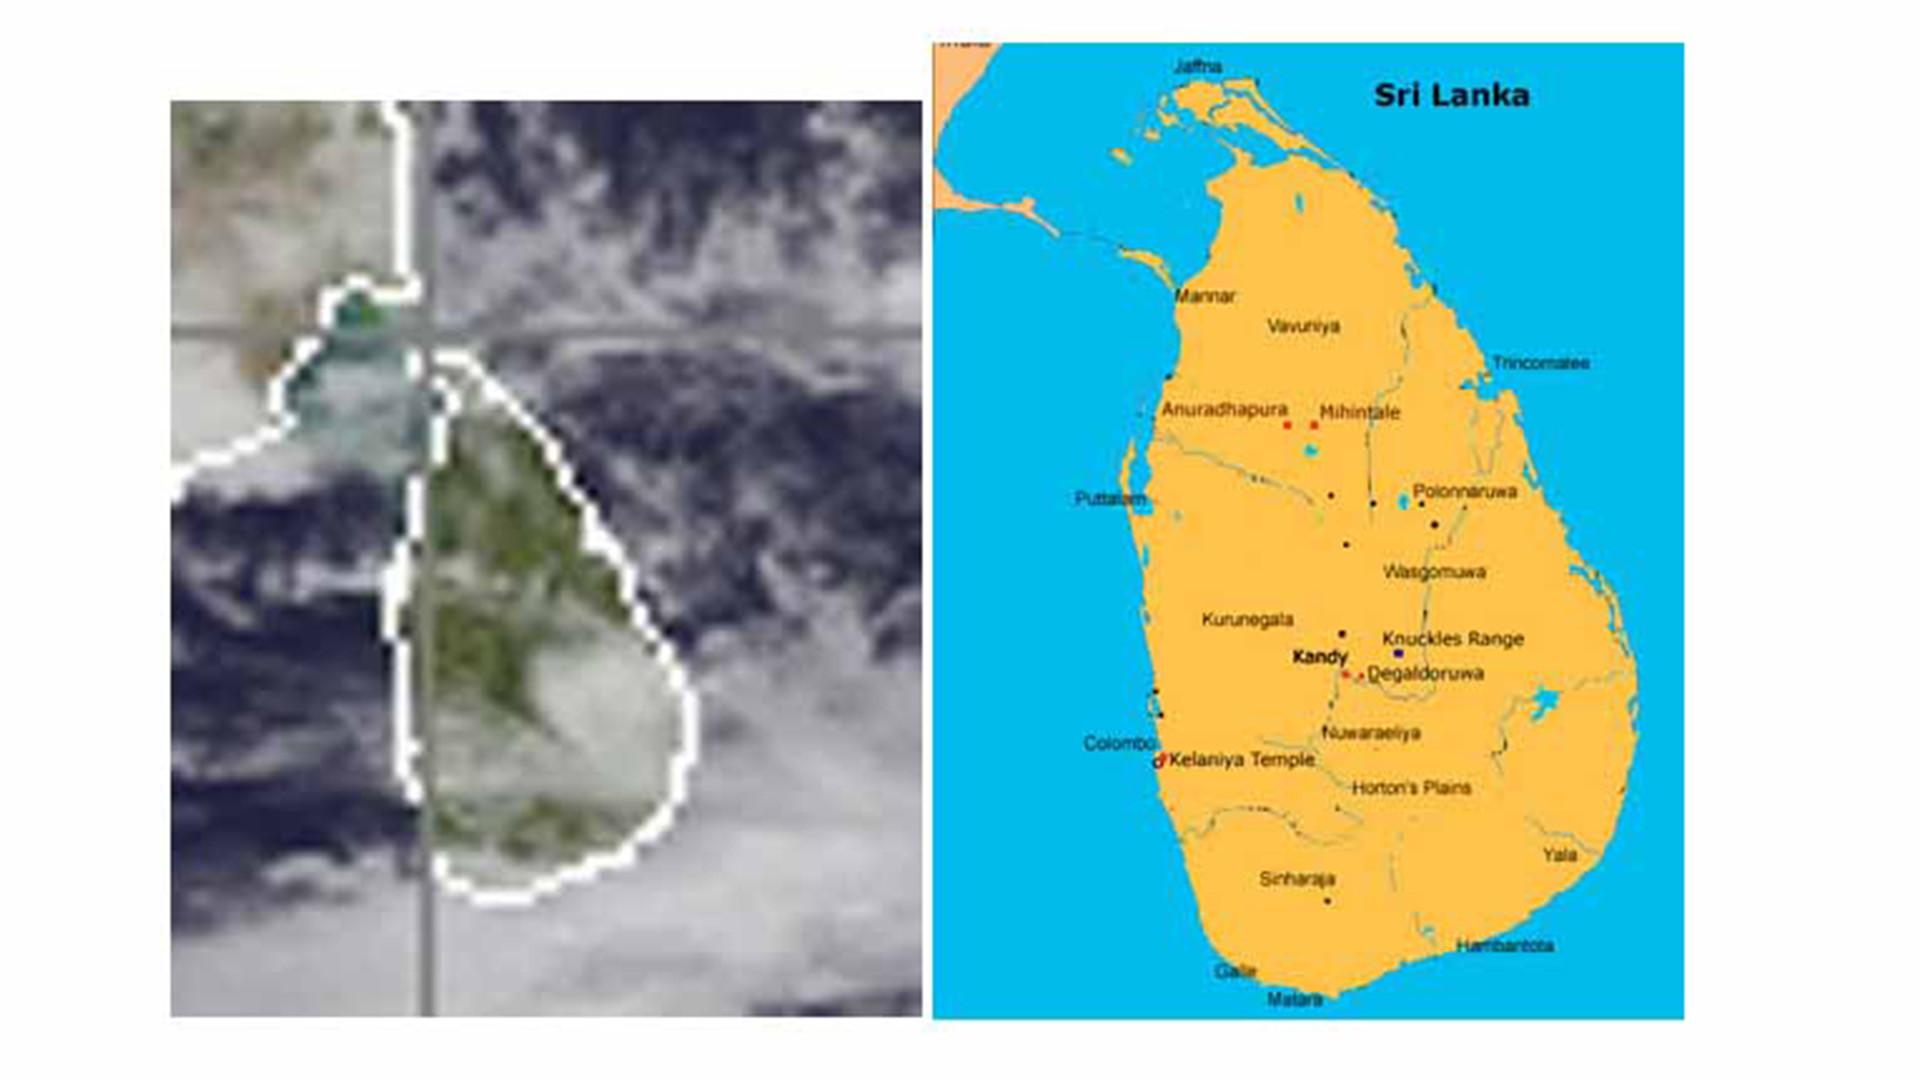
Identify the rain clouds on the map. Click for the larger map
If you are unfamiliar with Satellite Weather maps, the following example
reading may be of help to identify the rain clouds on the map.
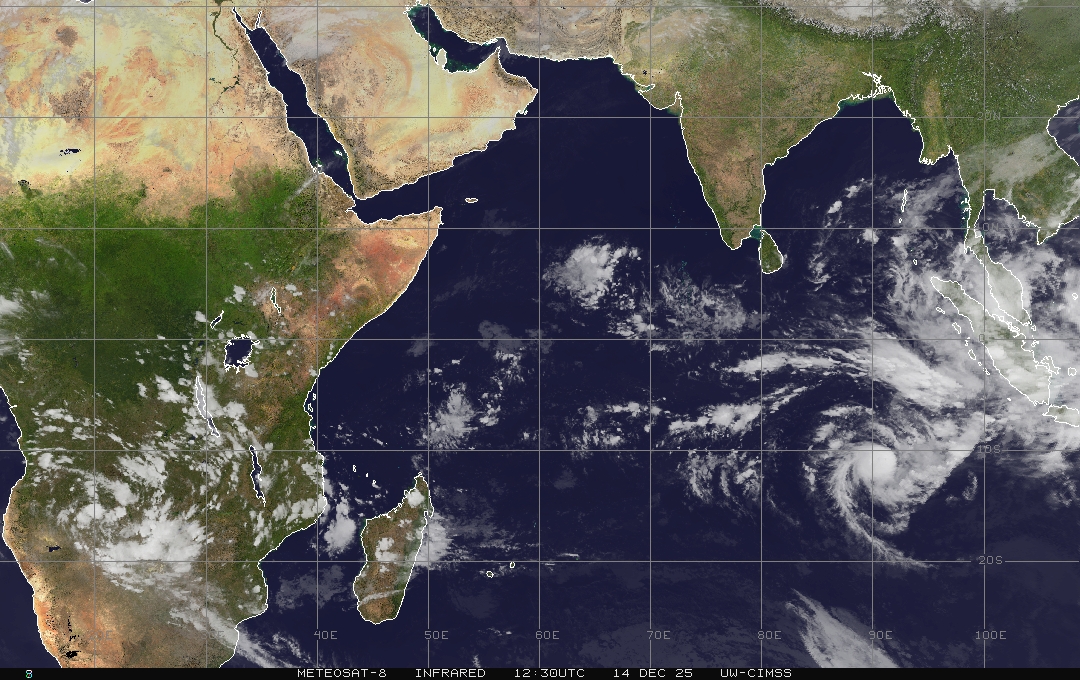
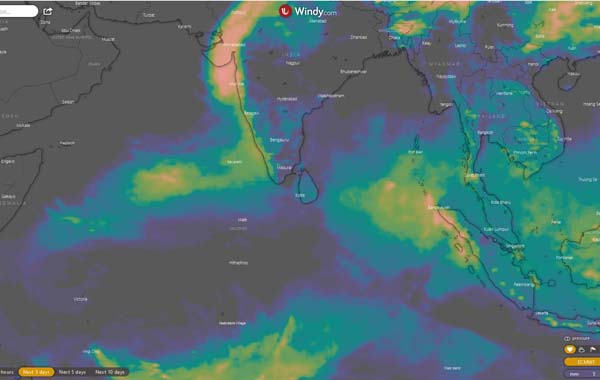
Example
reading from an enlarged Sri Lanka map obtained from a Satellite Weather
Image
The
enlarged Sri Lanka map can be seen here with India in the north west direction
and blue coloured Indian Ocean surrounding the island.The cloud like formation
appearing in white is the probable rain clouds covering the south east
section of the island.
A bigger cloud formation is already at the southern
section of the island so the rain cloud activity will be there for the
southern part of the island for few more hours. The island is 268 miles
lengthwise and 139 miles across at it's maximum width.
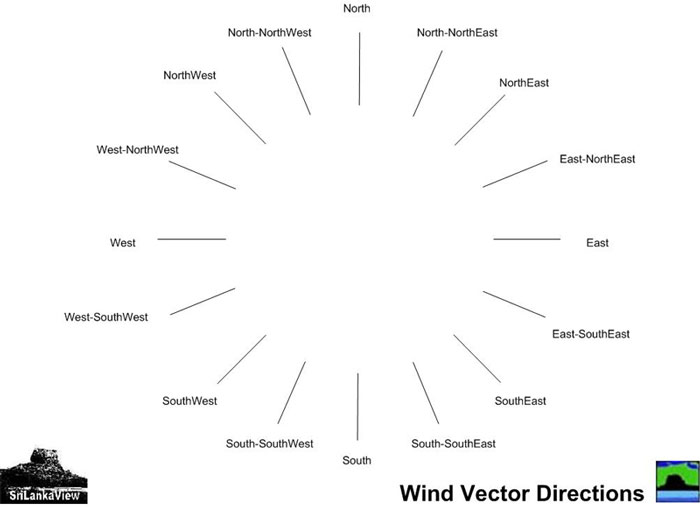
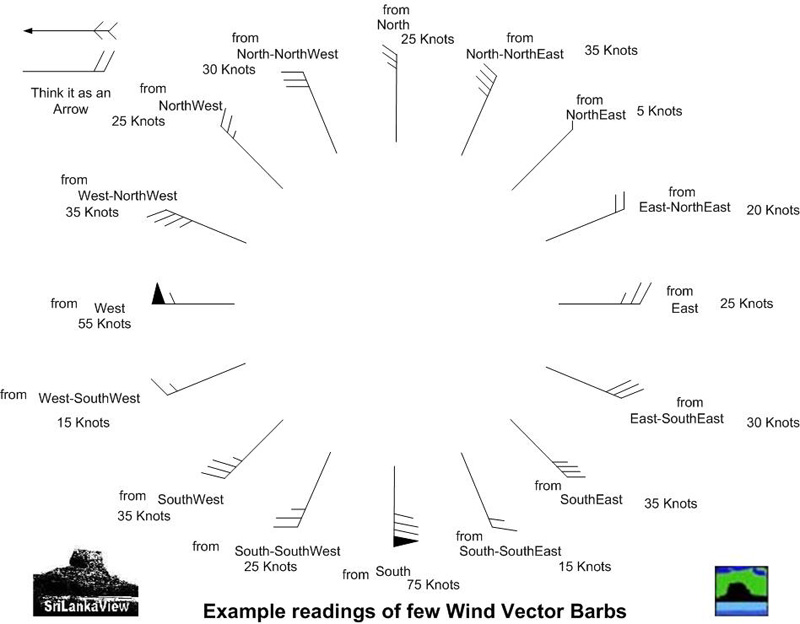
We can know the
wind speeds from the data maps provided and can assume roughly how much
time a rain cloud covers the territory or the approach of a rain cloud
and also a rough idea of the rain cloud size, compared to the size of
the island.
Latest